 Balance Guard
What Is and Why the 10-Year Yield Is a Key Indicator for Traders
If you want to understand where the global economy may be heading, many professional traders start by watching the 10-Year Treasury Yield.
This interest rate is often called one of the most important numbers in global finance.
Why?
Because it influences the cost of borrowing across the entire economy - from mortgages and corporate debt to stock valuations and currency flows.
When the 10-Year Yield moves, it can shift trillions of dollars between asset classes such as stocks, bonds, commodities, and currencies.
For traders and investors, tracking this yield helps reveal changes in market sentiment, liquidity, and economic expectations.
Key Takeaways
What Traders Watch in the 10-Year Yield
- Direction of the trend: Rising yields usually signal stronger growth expectations or inflation pressures, while falling yields often indicate a shift toward safe-haven assets.
- Yield curve shape: The relationship between the 2-Year and 10-Year Treasury yields helps identify potential economic slowdowns or recessions.
- Impact on equity valuations: Higher yields increase the discount rate used to value future earnings, often putting pressure on growth stocks.
- USD strength: Rising yields tend to attract foreign capital into U.S. assets, which can strengthen the U.S. dollar.
- Risk sentiment: Rapid declines in yields often indicate a shift toward risk-off behaviour across global markets.
What Is the 10-Year Treasury Yield
The 10-year Treasury yield is the annual return investors receive for holding a 10-year U.S. Treasury bond.
To understand the yield, you first need to understand the bond. When the United States government needs to raise money, it issues debt in the form of Treasury Bonds.
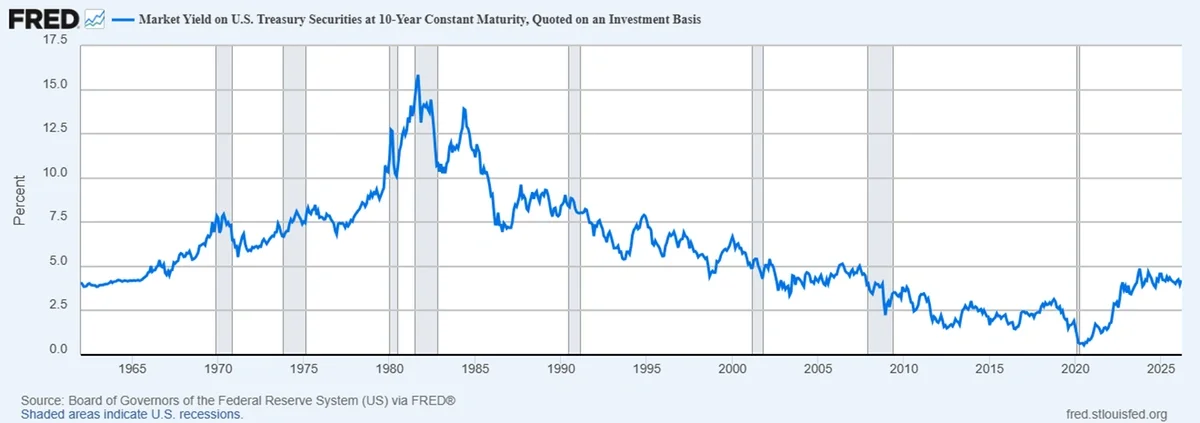
The 10-Year Yield is the annual interest rate the U.S. government pays to investors who lend them money for a decade. Because the U.S. government has never defaulted on its debt, this yield is considered the Risk-Free Rate. It is the baseline against which every other investment in the world is measured.
Historically, this yield has fluctuated significantly depending on inflation and monetary policy, ranging from levels above 15% in 1981 to below 1% during the pandemic-era lows in 2020, according to data from the Federal Reserve Economic Data (FRED) database.
How 10-Year Yield Is Determined
The 10-year Treasury yield is determined by supply and demand in the bond market.
Several factors influence this demand:
Inflation Expectations
If investors expect inflation to rise, they demand higher yields to compensate for the declining purchasing power of future payments.
Economic Growth
Strong economic growth often leads to higher yields, as investors move money into riskier assets like stocks.
Federal Reserve Policy
Although the Federal Reserve directly controls short-term interest rates, its policies influence expectations for long-term yields.
Global Capital Flows
International investors often buy U.S. Treasuries during periods of economic uncertainty, which can push yields lower.
These factors make the 10-year yield a real-time indicator of macroeconomic expectations.
How It Works: The Inverse Correlation
One of the most important concepts for a new trader is the inverse correlation between bond prices and yields. Think of it like a seesaw:
When Bond Prices go Up, Yields go Down.
When Bond Prices go Down, Yields go Up.
When investors are worried about the economy, they rush to buy bonds for safety. This high demand drives the price up and the yield down. Conversely, when the economy is booming or inflation is rising, investors sell bonds to buy riskier assets, which drives the yield up.
This happens because a bond yield reflects the return investors receive relative to the price they pay for that bond in the market. When demand increases and bond prices rise, the fixed interest payments represent a smaller return relative to the higher price, which pushes yields lower. When bond prices fall, the same fixed payments represent a higher return, causing yields to rise.
Why Is It a Key Indicator for Traders
The 10-Year Yield acts as a form of gravity for the markets. Its utility covers three main areas:
- Benchmark for Interest Rates: The 10Y Yield directly influences mortgage rates, car loans, and corporate debt. When the 10Y rises, borrowing becomes more expensive for everyone.
- The Valuation of Stocks: Analysts use the 10Y Yield as the discount rate to determine the present value of future earnings. When yields rise, the valuation of sectors sensitive to interest rates tends to drop. This is especially true for Nasdaq (Technology) and Russell (Growth and Small Caps).
- Currency Strength (USD): Higher yields attract foreign capital seeking better returns. This typically strengthens the U.S. Dollar against other currencies.
How to Analyze the 10Y
Traders do not look at the 10Y yield in isolation. They analyze it in relation to other asset classes to identify high-probability setups. Below are the primary signals used to predict market moves:
Trend Confirmation and Economic Outlook: A steady uptrend in the 10Y suggests that the market is pricing in economic expansion or persistent inflation. When this happens, traders often look for Relative Strength in cyclical sectors like Financials and Energy. Conversely, a steady downtrend indicates a "flight to quality," where capital moves out of stocks and into the safety of government debt.
The Yield Curve Inversion (2Y vs. 10Y)
The relationship between short-term and long-term Treasury yields provides one of the most important signals about the health of the economy. Traders and macro investors often monitor the spread between the 2-Year Treasury Yield and the 10-Year Treasury Yield as a gauge of future economic expectations.
Under normal economic conditions, longer-term bonds such as the 10-Year Treasury typically offer higher yields than shorter-term bonds like the 2-Year Treasury. This happens because investors demand additional compensation for locking their capital away for a longer period, as longer maturities carry greater uncertainty related to inflation, interest rates, and economic growth.
The difference between these two yields is known as the yield curve spread, and it reflects how the market is pricing the future path of interest rates and economic activity.
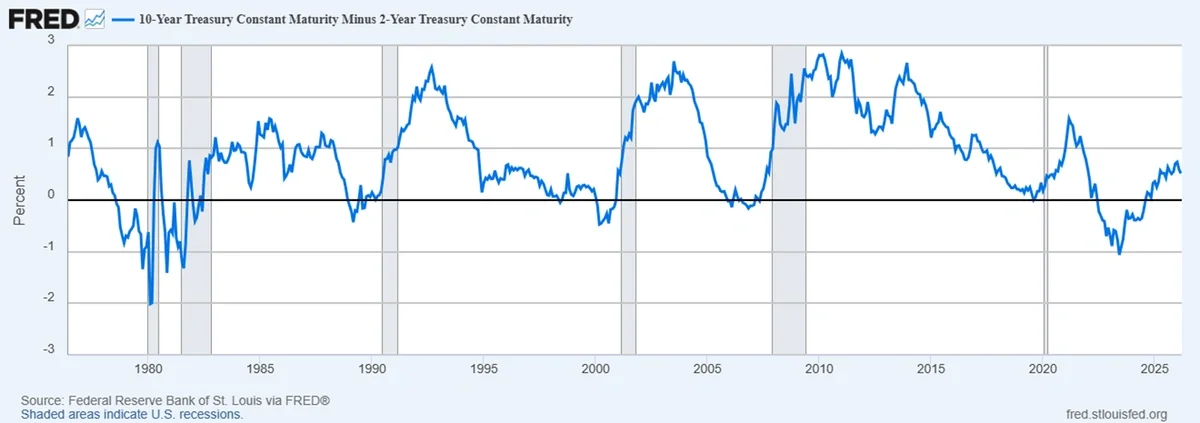
The chart below illustrates the spread between the 10-Year and 2-Year Treasury yields, one of the most widely monitored indicators in macroeconomic analysis.
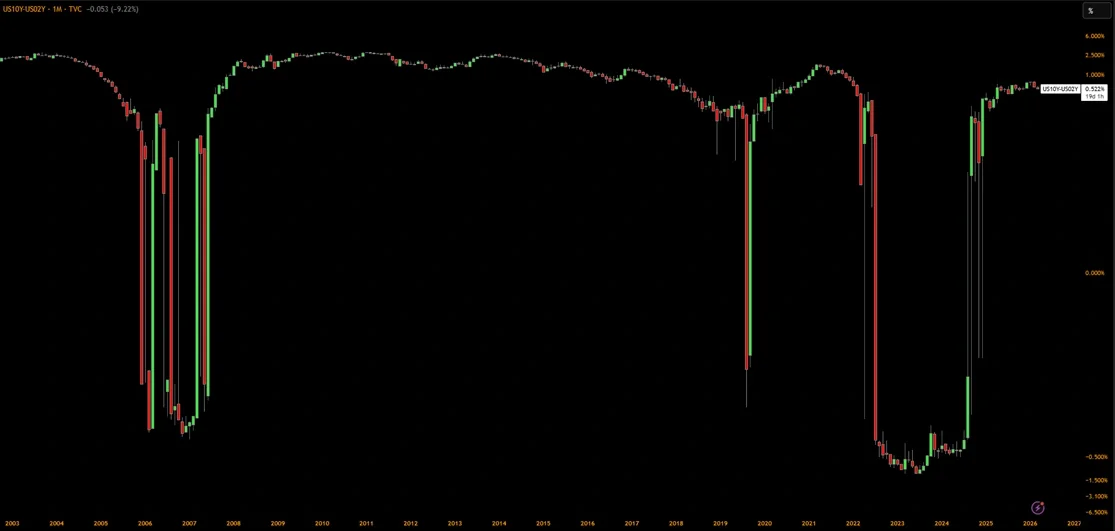
The Signal: Under normal conditions, the 10-Year Treasury yield remains above the 2-Year yield, creating an upward-sloping yield curve. However, when the 2-Year yield rises above the 10-Year yield, the curve becomes inverted. This inversion typically occurs when markets expect central banks to keep interest rates high in the short term while economic growth slows in the future.
Practical Impact: Historically, an inverted yield curve has preceded every U.S. recession since the 1970s, based on data from the Federal Reserve Economic Data (FRED) database. The spread between the 2-Year and 10-Year Treasury yields has historically turned negative before major economic downturns, including the recessions of 1990, 2001, 2008, and 2020.
For traders, this signal is closely monitored because it often marks a transition in the market cycle. During periods of yield curve inversion, investors tend to reduce exposure to high-growth and risk-sensitive assets while increasing allocations to defensive sectors, government bonds, and other safe-haven instruments.
Practical Correlations with Tradable Assets
To trade the 10Y Yield effectively, you must understand its negative correlation with specific instruments:
Gold (XAUUSD): Gold is a non-yielding asset. When the 10Y Yield rises, the "opportunity cost" of holding Gold increases because investors can get a guaranteed return from bonds instead. This often leads to a sell-off in Gold.
Nasdaq (US100): High-growth tech companies are valued based on future cash flows. A spike in the 10Y Yield increases the discount rate, which mathematically lowers the current price of these stocks. A rising 10Y is often the primary catalyst for a Nasdaq correction.
USD/JPY: This is one of the cleanest correlations in the Forex market. Because Japan maintains very low interest rates, a rising 10Y Yield increases the interest rate differential between the US and Japan. This typically drives the USD/JPY pair significantly higher.
A more recent example occurred in 2023, when the 10-Year Treasury Yield surged to nearly 5% in October, its highest level in about 16 years. The rapid rise in long-term yields triggered a wave of volatility across equity markets as investors reassessed valuations in a higher interest-rate environment. During that period, major equity indices, particularly growth-heavy sectors, came under pressure as higher bond yields made risk-free returns more attractive relative to stocks and increased the discount rate applied to future corporate earnings.
How to Use This to Your Advantage
As a trader or investor, you can use the 10Y yield to time your entries and manage risk:
Risk Mitigation and Dynamic Position Sizing
When the 10Y Yield experienced a sharp, momentum-driven breakout above key technical resistance, it acted as a primary warning signal for risk assets.
- High-Beta Sensitivity: Assets such as Nasdaq (US100), Small Caps (Russell 2000), and Cryptocurrencies have a high sensitivity to rising discount rates.
- The Trading Rule: When the 10Y yield spikes, professional traders often tighten stop-losses or reduce position sizes in these sectors. A rising yield increases the "cost of carry," making speculative long positions more expensive and riskier to hold.
Market Sentiment Analysis: The 10Y yield serves as a primary barometer for global risk appetite. By monitoring the velocity and direction of yield movements, traders can identify which market regime is currently in control.
The Risk-Off Environment
A risk-off environment occurs when investors become concerned about economic or financial stability.
This can happen during events such as:
- Geopolitical conflicts
- Economic recessions
- Banking instability
- Unexpected financial shocks
During these periods, institutional investors prioritize capital preservation over high returns.
As a result, they begin selling risk assets, including:
- Stocks
- High-yield corporate bonds
- Cryptocurrencies
Instead, capital flows into safe-haven assets, particularly U.S. Treasury bonds.
This surge in demand pushes bond prices higher and yields lower.
For traders, a rapidly falling 10-Year Yield can act as an early signal of rising market fear.
It often appears before increases in market volatility and declines in major equity indices.
The Risk-On Environment
A risk-on environment occurs when investors feel confident about economic growth and corporate earnings.
In this environment, capital begins moving away from safe assets and toward growth opportunities.
This shift usually results in:
- Investors selling government bonds
- Increasing demand for stocks and commodities
- Rising Treasury yields
A steady and controlled rise in yields often reflects expectations of stronger economic growth.
During these periods, traders frequently see strong performance in:
- Cyclical sectors such as energy and financials
- Industrial commodities
- Emerging markets
However, traders must monitor how quickly yields rise.
If yields increase too rapidly due to inflation concerns, borrowing costs can rise enough to slow economic activity and pressure equity markets.
Why This Matters for Your Execution
Understanding these regimes allows a trader to align their strategy with prevailing market conditions.
- In a Risk-Off environment (falling yields), trying to "buy the dip" in the Nasdaq is statistically more dangerous.
- In a Risk-On environment (rising yields), shorting the market based on valuation alone can be a trap, as the momentum of economic confidence often overpowers standard technical indicators.
Yield Trapping and Fixed-Income Allocation
For long-term investors, periods of historically high bond yields can create a strategic opportunity known as yield trapping.
Yield trapping is the process of locking in high interest rates before yields begin to decline.
This strategy is most attractive when:
- Interest rates appear near their peak
- Central banks may begin cutting rates
- Economic growth starts slowing
By purchasing bonds when yields are elevated, investors secure higher fixed income payments than may be available later.
If yields eventually fall, those bonds can also increase in market value, creating an opportunity for capital gains.
This strategy typically emerges after periods of aggressive interest rate hikes by central banks, when long-term Treasury yields rise to unusually high levels compared to historical averages. At these moments, newly issued bonds begin offering significantly higher interest payments than those available in previous years.
When these elevated yield levels appear, investors may allocate capital into longer-duration Treasury bonds to lock in those higher interest rates for an extended period. Because U.S. Treasuries are considered among the safest assets in global markets, this allows investors to secure a relatively stable income stream backed by the U.S. government.
Over time, if inflation pressures begin to ease and economic growth slows, central banks often shift toward lowering interest rates. As market interest rates decline, Treasury yields tend to fall as well.
Because bond prices move inversely to yields, the value of bonds purchased during periods of elevated yields can increase significantly. In this environment, investors may benefit not only from fixed coupon payments but also from potential capital appreciation if those bonds are later sold in the secondary market.
- Capital Appreciation via Mean Reversion: Beyond the fixed coupon payments, hitting historical highs in yields often precedes a mean reversion phase. Due to the inverse relationship between price and yield, as the 10Y yield eventually declines, the market value of the bonds increases. This provides an opportunity for significant capital gains in addition to the annual yield.
- Managing Duration Risk: Professional traders monitor Duration, a measure of a bond's price sensitivity to interest rate changes. When yields are at historical extremes, increasing duration in a portfolio can be a highly effective strategy to capitalize on a future downward shift in the yield curve.
- The Tipping Point for Equity Rotation: Institutional capital often uses these historical yield peaks as a signal for asset rotation. If the 10Y Treasury Yield significantly exceeds the S&P 500 Dividend Yield, the risk-adjusted return of bonds becomes more attractive than equities, leading to a massive shift in global liquidity that can cap equity market upside.
Conclusion
The 10-Year Treasury Yield is far more than a benchmark for fixed income. It represents the primary driver of global capital allocation. For traders, failing to monitor 10Y fluctuations results in a significant blind spot regarding systemic risk and liquidity shifts. By mastering the mechanics of the "Risk-Free Rate," you gain a decisive advantage in anticipating adjustments in equity valuations, currency trends, and commodity cycles.
Keep the 10Y on your primary watchlist. When global liquidity conditions shift, the most significant opportunities are often captured by those who can interpret these macro signals before they are fully priced into the broader market.
Frequently Asked Questions (FAQ)
What is the 10-Year Treasury Yield?
The 10-Year Treasury Yield is the annual return investors receive for lending money to the U.S. government for 10 years by purchasing a Treasury bond.
It is widely considered a benchmark interest rate because it influences borrowing costs across the economy, including mortgages, corporate loans, and government debt.
Why is the 10-Year Treasury Yield important for traders?
The 10-Year Yield helps traders understand market expectations for inflation, economic growth, and interest rates.
Movements in the yield can affect multiple asset classes, including:
- Stock market valuations
- Currency strength (especially the U.S. dollar)
- Commodity prices such as gold
- Mortgage and lending rates
Because of this, many traders treat the 10-Year Yield as a key indicator of global liquidity and market sentiment.
Why do stocks often fall when the 10-Year Yield rises?
Rising yields increase the discount rate used to value future corporate earnings.
This means future profits are worth less in today's dollars, which can lower stock valuations.
Growth sectors like technology and small-cap stocks are especially sensitive because their earnings are expected further in the future.
What does an inverted yield curve mean?
A yield curve inversion occurs when short-term Treasury yields rise above long-term yields, such as when the 2-Year Treasury Yield exceeds the 10-Year Yield.
Historically, an inverted yield curve has been a reliable warning signal of a potential economic recession.
It suggests investors expect slower growth or lower interest rates in the future.
How does the 10-Year Yield affect the U.S. dollar?
Higher Treasury yields often attract foreign investors seeking better returns.
To invest in U.S. bonds, international investors must first buy U.S. dollars, which increases demand for the currency.
As a result, rising yields frequently lead to a stronger U.S. dollar in the foreign exchange market.
Why does gold often fall when Treasury yields rise?
Gold does not generate interest or income.
When Treasury yields rise, investors can earn higher returns from government bonds, increasing the opportunity cost of holding gold.
This often leads some investors to move money from gold into interest-bearing assets like bonds, putting downward pressure on gold prices.
What is yield trapping?
Yield trapping is an investment strategy where investors buy bonds when yields are historically high to lock in attractive interest rates.
If yields fall later, the price of those bonds increases, allowing investors to potentially benefit from both:
- Stable income from the bond yield
- Capital gains from rising bond prices
Why should investors monitor duration risk?
Professional bond investors closely monitor duration, a measure of how sensitive a bond's price is to changes in interest rates.
In simple terms:
- Higher duration = larger price changes when yields move
Longer-term bonds typically have higher duration, which means their prices respond more strongly to shifts in interest rates.
This is why many investors increase their portfolio duration when yields are historically high.
If yields decline later, longer-duration bonds can deliver larger capital gains.
Where can traders track the 10-Year Treasury Yield?
Traders can monitor the 10-Year Yield through financial data platforms such as:
- Federal Reserve economic data (FRED)
- Major financial news platforms
- Trading platforms that display Treasury yield charts
Many traders keep the 10-Year Yield chart on their watchlist alongside major market indices.
How to Use Equity Rotation
Institutional investors often compare Treasury yields with equity income when deciding how to allocate capital.
One common comparison is between:
- The 10-Year Treasury Yield
- The S&P 500 dividend yield
When Treasury yields rise significantly above dividend yields, bonds can become more attractive on a risk-adjusted basis.
This can trigger a shift in global capital allocation.
Investors may begin moving money out of equities and into bonds, especially large institutional portfolios seeking stable income.
When this rotation occurs at scale, it can limit upside momentum in equity markets.
Top 5 Blogs